أهمیه العناصر البصریه فی الأوراق الأکادیمیه
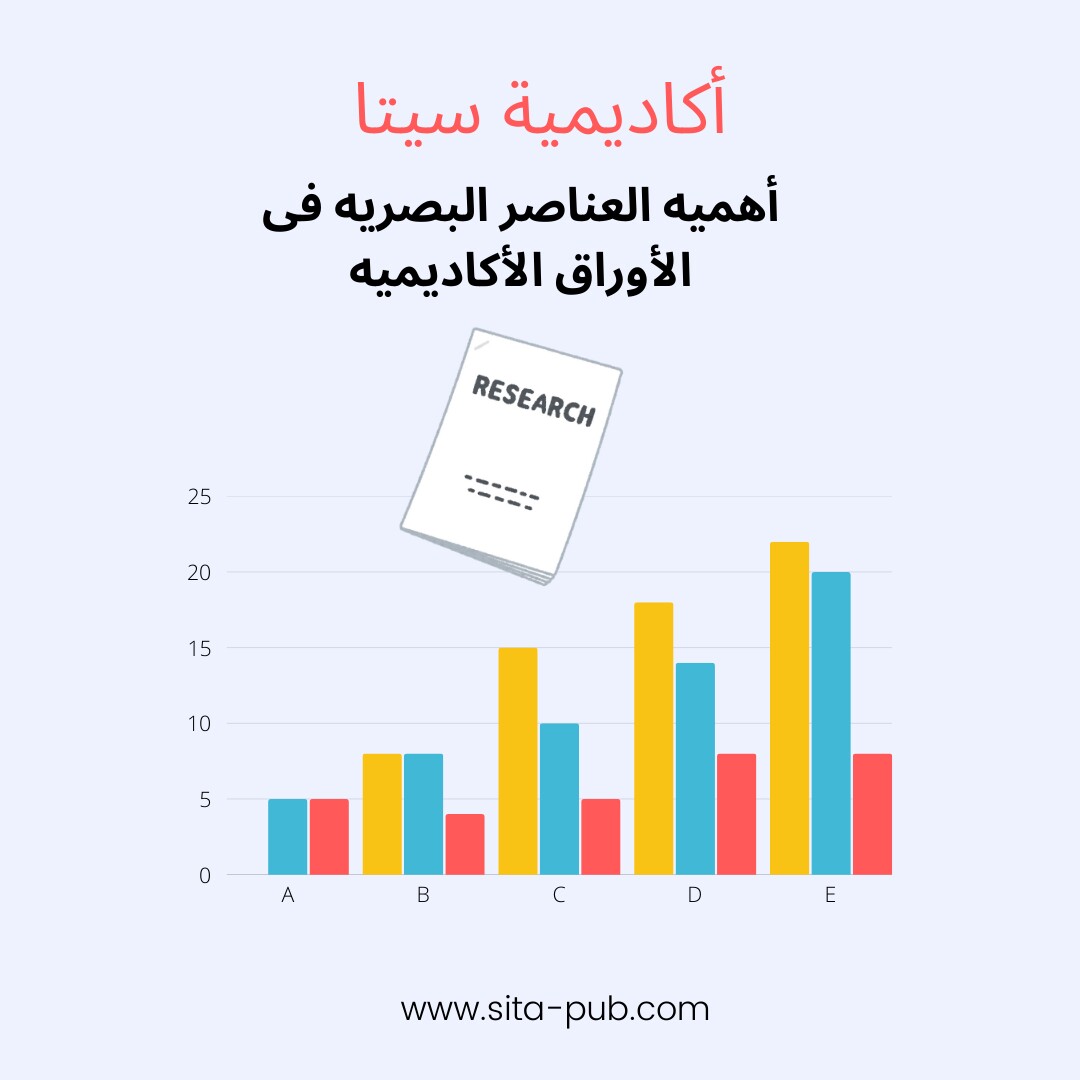

العناصر البصریه فی الکتابه الأکادیمیه لها أهمیه کبیره. فهی تساعد القراء على فهم المعلومات بشکل أفضل وتحافظ على اهتمامهم. أهمیه العناصر البصریه فی الأوراق الأکادیمیه واضحه: فهی تجعل المعلومات المعقده أسهل للفهم. یستعرض هذا الدلیل أنواع العناصر البصریه الأکادیمیه، وفوائدها، والأخطاء الشائعه، وکیفیه استخدام أدوات الذکاء الاصطناعی لإنشاء رسومات فعاله.
العناصر البصریه تأتی بأشکال عدیده، کل منها یخدم غرضًا معینًا:
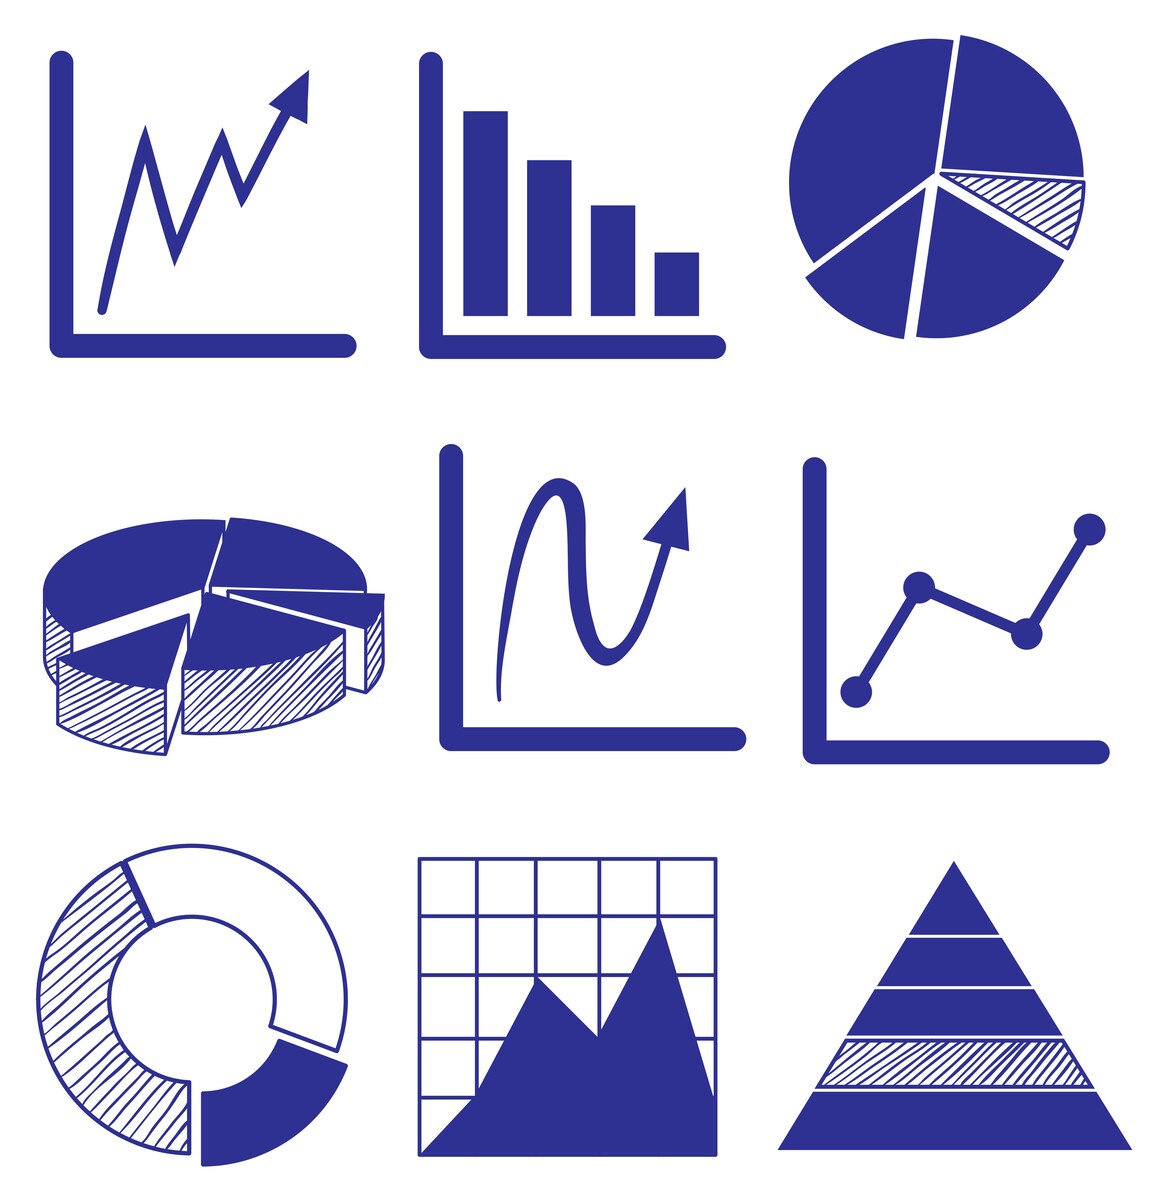
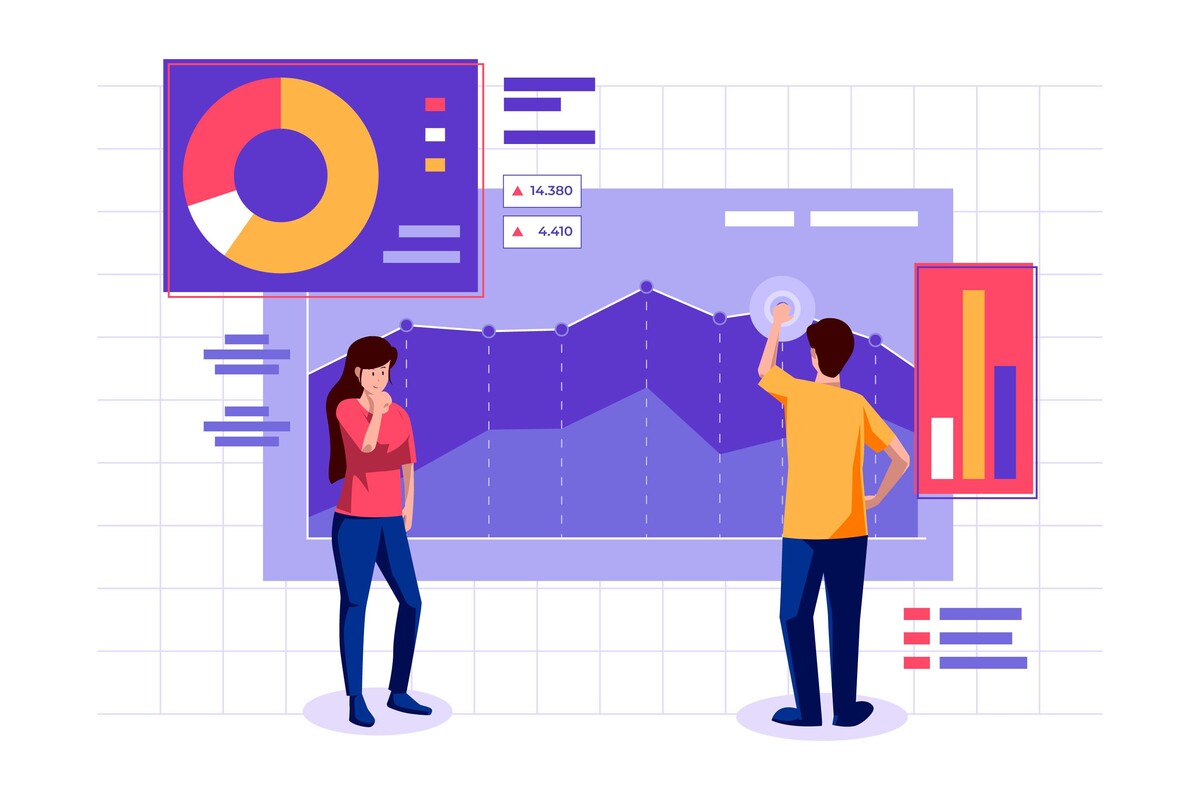
الرسوم البیانیه والمخططات تعرض البیانات الرقمیه بوضوح:
Line Graphs: تعرض التغیرات مع مرور الوقت، مثل ارتفاع درجات الحراره.
Bar Graphs: تقارن بین مجموعات مختلفه، مثل إحصائیات صحیه.
Pie Charts: تظهر أجزاء من کل، مثل توزیع المیزانیه.
Scatter Plots: تعرض العلاقه بین متغیرین، مثل ساعات الدراسه ونتائج الامتحانات.
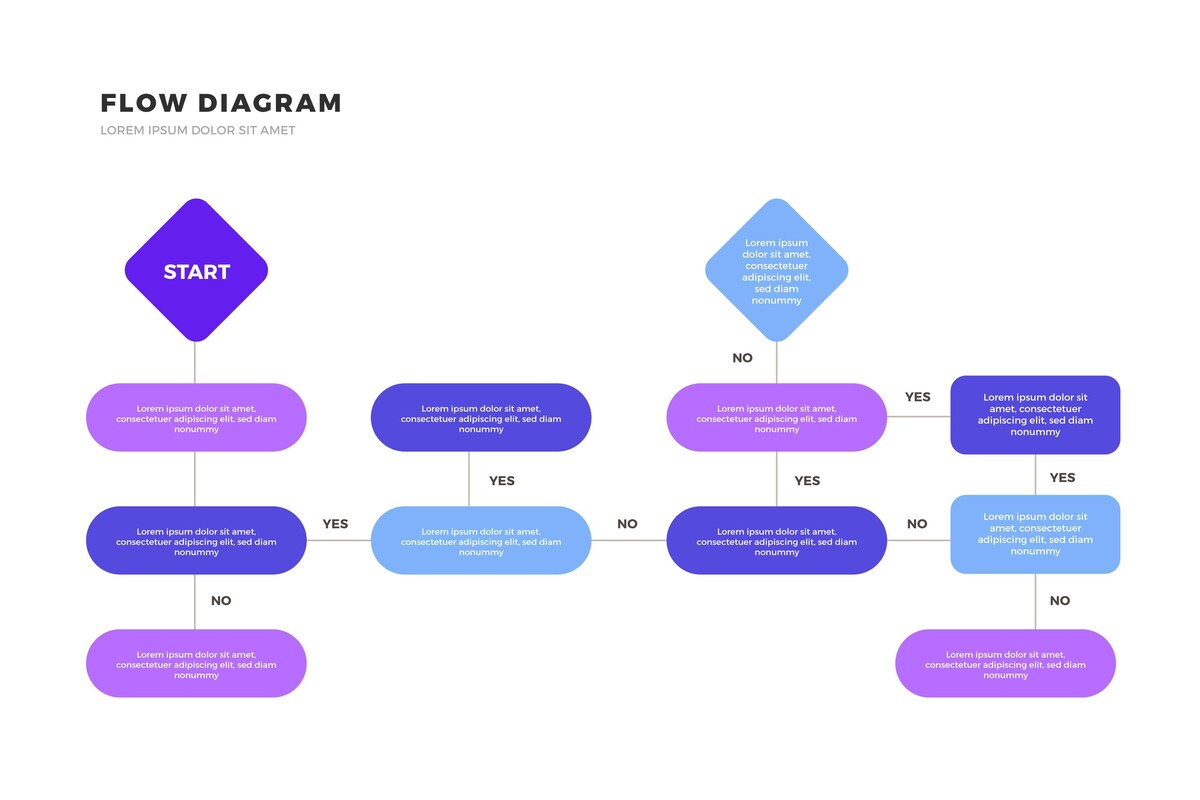
تُستخدم هذه الأدوات لشرح العملیات المعقده:
Flowcharts: تعرض خطوات العملیات مما یساعد على توضیح طرق البحث.
Process Diagrams: تشرح الأنظمه مثل دوره الماء.
Network Diagrams: توضح العلاقات والاتصالات مثل الشبکات الاجتماعیه.
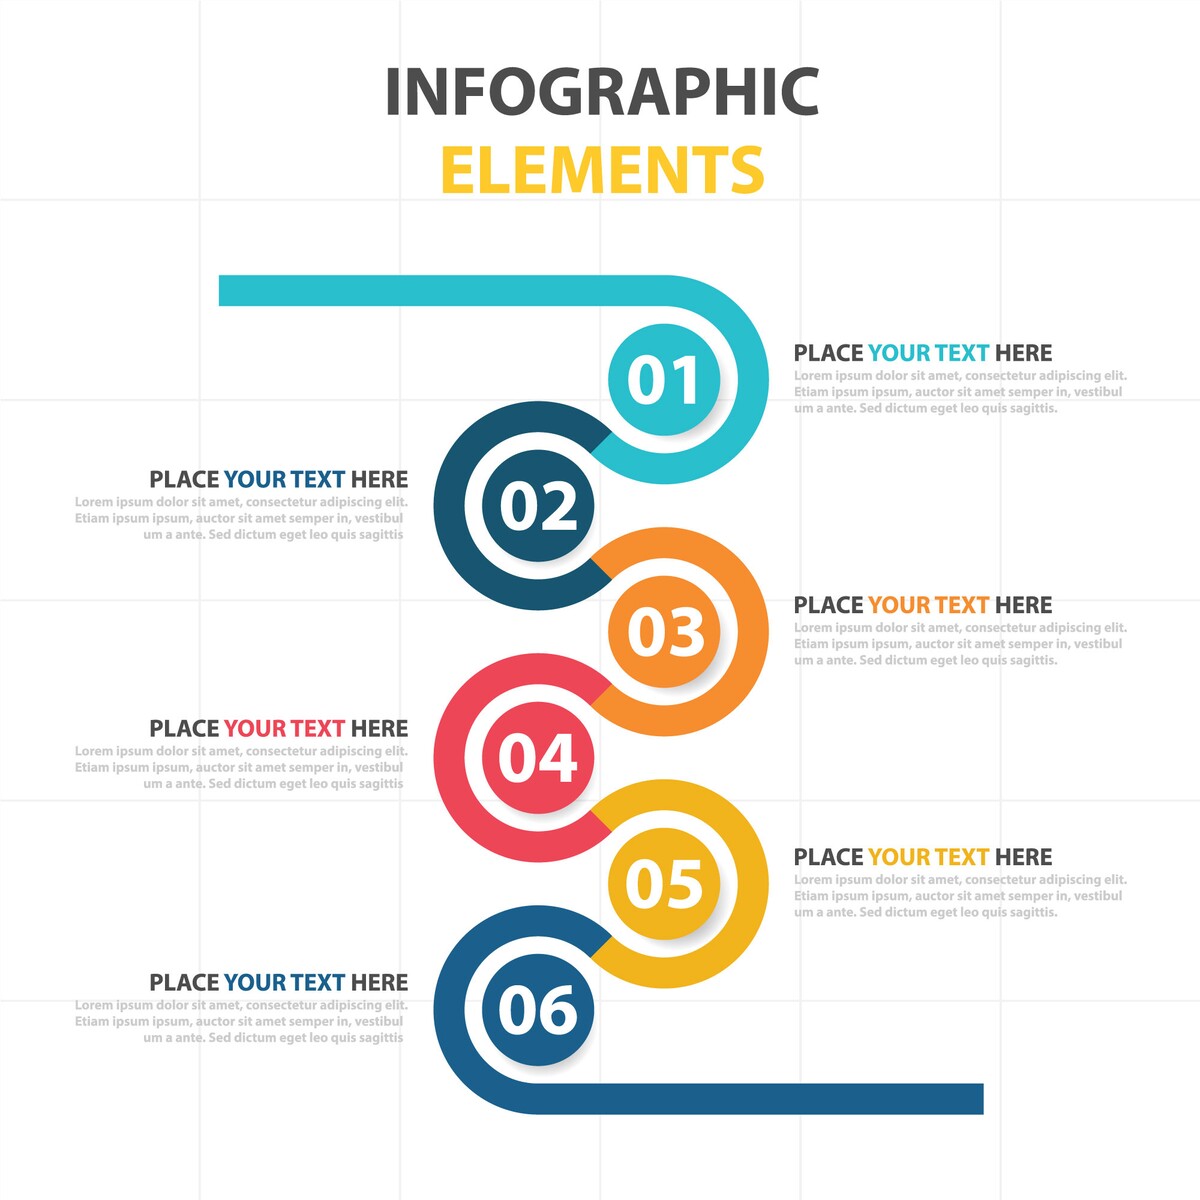
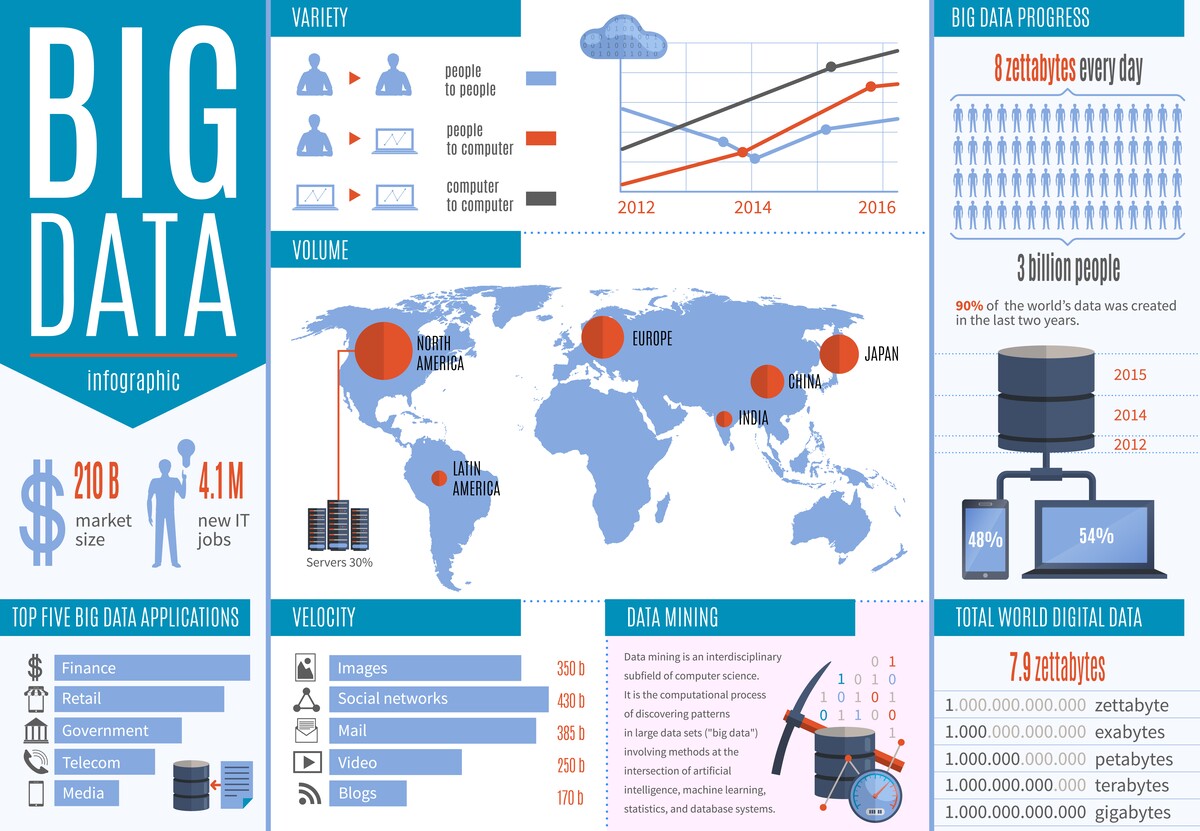
الرسوم المعلوماتیه تلخص المعلومات بطریقه بصریه:
Data-driven Infographics: تقدم الإحصاءات الرئیسیه بوضوح.
Conceptual Infographics: تصور الأفکار المعقده مثل التطور.
Timeline Infographics: تعرض الأحداث التاریخیه بمرور الزمن.
الخرائط مهمه لعرض البیانات الجغرافیه:
Choropleth Maps: تستخدم الألوان لعرض البیانات عبر المناطق.
Dot Maps: تعرض نقاط بیانات محدده مثل مواقع أنواع الحیوانات.
Flow Maps: توضح أنماط الحرکه مثل الهجره.
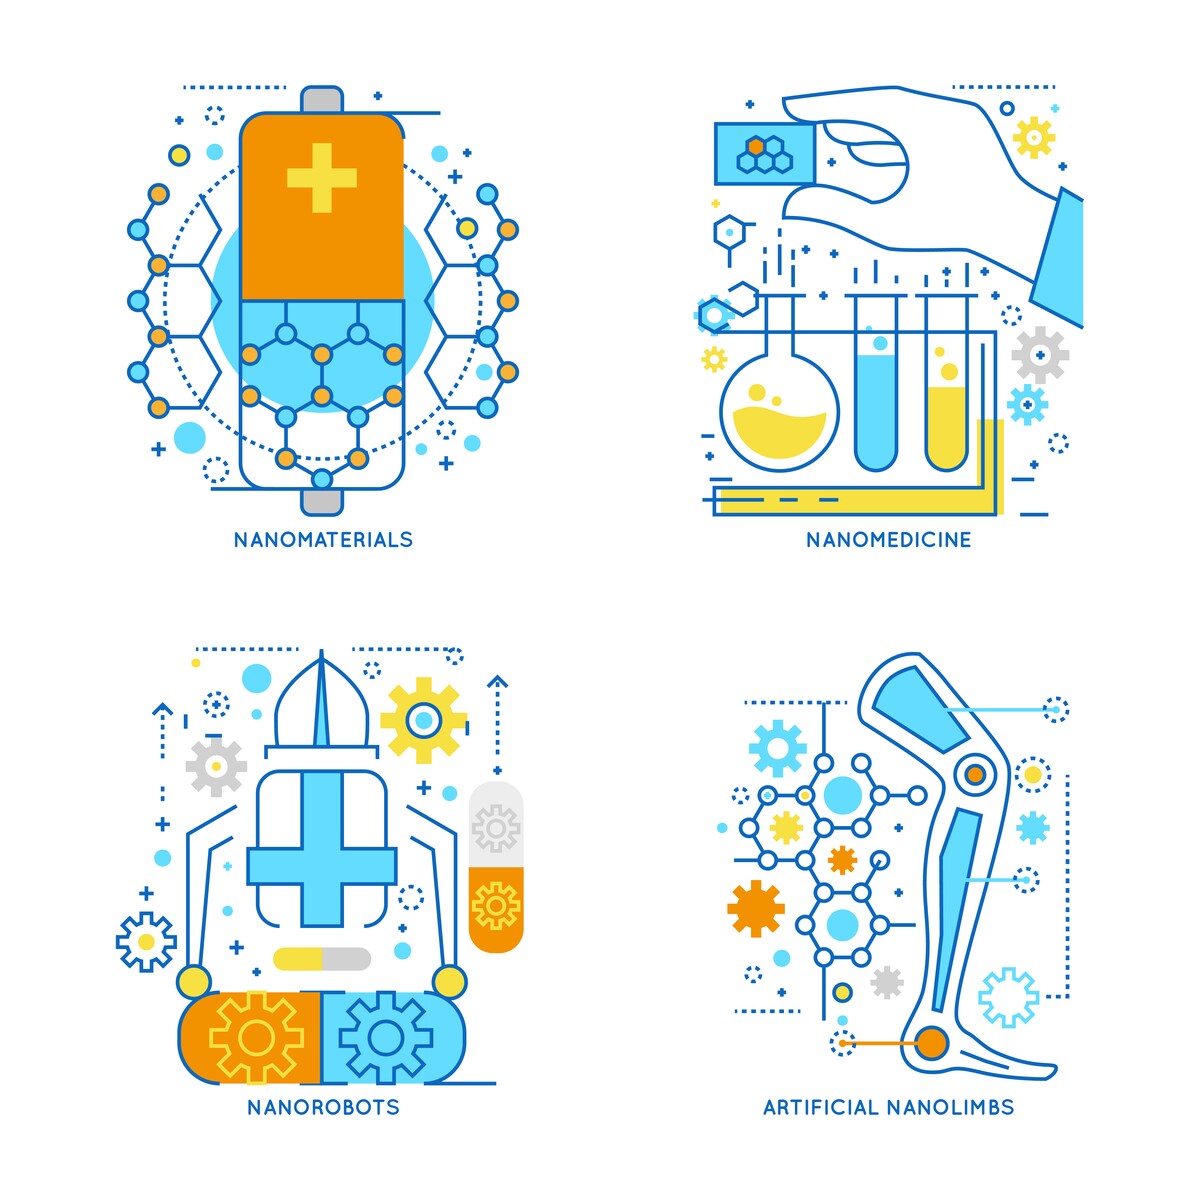
توفر الصور الفوتوغرافیه والرسومات السیاق وتدعم النتائج:
Microscopic Images: تظهر التفاصیل الدقیقه فی البیولوجیا.
Architectural Drawings: تمثل الأفکار التصمیمیه بشکل بصری.
Historical Photographs: توفر سیاقًا وأدله داعمه للأبحاث.
استخدام العناصر البصریه فی الأوراق الأکادیمیه یوفر العدید من الفوائد:
تحسین الفهم: تجعل المعلومات المعقده أسهل للفهم.
زیاده الاحتفاظ بالمعلومات: یتذکر الناس المعلومات البصریه أفضل من النصوص فقط.
زیاده التفاعل: تقطع العناصر البصریه النصوص الطویله وتحافظ على اهتمام القارئ.
وضوح الاتصال: تکشف الرسوم البیانیه عن الاتجاهات والروابط التی قد لا یوضحها النص.
تأثیر أکبر: الأوراق التی تحتوی على عناصر بصریه جذابه یتم مشارکتها واستشهادها بشکل أکبر.
حتى مع الفوائد، یرتکب الباحثون أحیانًا أخطاء:
تصامیم مزدحمه: الکثیر من العناصر یمکن أن تربک القارئ. حافظ على البساطه.
تمثیلات مضلله: تأکد أن العناصر البصریه تعکس البیانات بدقه.
صور بجوده ضعیفه: استخدام صور منخفضه الجوده یبدو غیر احترافی.
أنماط غیر متسقه: استخدام أنماط مختلفه قد یربک القارئ. التزم بتصمیم موحد.
یمکنک استخدام أدوات حدیثه لإنشاء عناصر بصریه ممیزه:
Tableau: ممتاز لإنشاء رسوم تفاعلیه.
Power BI: لإنشاء تقاریر جذابه.
Google Data Studio: أداه مجانیه لتصور البیانات.
Canva: سهل الاستخدام مع قوالب متنوعه.
Piktochart: یقدم خیارات تخصیص ممتازه.
Visme: یجمع بین الرسوم المعلوماتیه وأدوات العروض التقدیمیه.
Adobe Photoshop: لتحریر الصور بشکل احترافی.
GIMP: خیار مجانی قوی.
Adobe Illustrator: مثالی للرسومات عالیه الجوده.
Luminar AI: یعزز الصور باستخدام الذکاء الاصطناعی.
Topaz Labs: یقدم أدوات لتحسین جوده الصور.
Deep Dream Generator: ینشئ صورًا فنیه من الصور الفوتوغرافیه.
لجعل العناصر البصریه أکثر تأثیرًا، اتبع هذه الاستراتیجیات:

اختر النوع المناسب: حدد النوع الأنسب بناءً على البیانات.
حافظ على البساطه والوضوح: تجنب التعقید الزائد.
استخدم صورًا عالیه الجوده: لضمان المصداقیه والمهنیه.
قدّم عناوین وتعلیقات واضحه: لکل عنصر بصری.
ادمج العناصر بسلاسه مع النص: اجعل العناصر جزءًا من سیاق الورقه.
استخدم الألوان بحکمه: لتعزیز الوضوح ولیس الإرباک.
ضع فی اعتبارک سهوله الوصول: استخدم ألوانًا عالیه التباین وقدم أوصافًا نصیه للصور.
إن دمج العناصر البصریه المصممه جیدًا یمکن أن یحسن بشکل کبیر من وضوح وتأثیر الأعمال الأکادیمیه. من خلال استخدام أدوات الذکاء الاصطناعی الحدیثه واتباع أفضل الممارسات فی تصمیم العناصر البصریه الأکادیمیه، یمکن للباحثین إنشاء رسومات تعزز أوراقهم وتجذب جمهورهم.
مع تطور النشر الأکادیمی، ستزداد أهمیه المهارات البصریه، مما یجعل من الضروری للباحثین تطویر مهاراتهم فی الاتصال البصری.
باتباع هذه الاستراتیجیات، یمکن للکتاب الأکادیمیین ضمان تمیز أبحاثهم والمساهمه بشکل مؤثر فی مجالاتهم.
تقدم أکادیمیه سیتا خدمات تنسیق احترافیه لضمان أن یظهر عملک بمظهر مهنی ویلبی المعاییر الأکادیمیه. نقوم أیضًا بتنسیق الجداول الخاصه بک، مع التأکد من أنها واضحه وسهله القراءه. دعنا نساعدک فی تقدیم بحثک بشکل جمیل وممیز.

إذا کان لدیک أی أسئله، استفسارات، أو ترغب فی معرفه المزید عن خدماتنا، فلا تتردد فی التواصل معنا. فریقنا المخصص مستعد لمساعدتک.